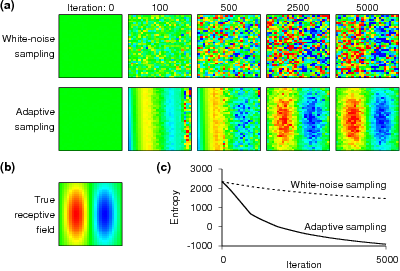
Adaptive estimation of receptive fields, as demonstrated by a
numerical simulation study. (a) The top row shows how the
structure of a receptive field builds up gradually when a
standard neurophysiological approach is used. Here,
white-noise stimuli are presented and the receptive field is
estimated as the spike-triggered average. The bottom row shows
results from an adaptive sampling technique in which each new
stimulus is selected such that it maximizes the information
gained about the receptive field. (b) The true receptive
field. (c) The uncertainty of the estimates, quantified by the
entropy of the parameter distribution, drops far more rapidly
for the adaptive sampling technique than for white-noise
sampling (data provided by courtesy of J. Lewi).
From Benda et al. 2007,
as modified from Lewi J, Butera R, Paninski L: Real-time
adaptive information-theoretic optimization of
neurophysiology experiments. In Adv Neural Inf Process Syst,
Volume 19. Edited by Scholkopf B, Platt J, Hoffman
T. Cambridge, MA: MIT Press; 2007:857-864.

